This is adapted from the Enrollment Outlook in the 2020-2021 Trendbook, available in the NAIS Bookstore.
By Joseph Corbett and Amada Torres
By exploring trends from the Great Recession of 2007-2009 and its aftermath, schools can gain insights into what the current crisis may mean for them.
Attrition changed significantly throughout the 2007-2009 recession. The median attrition rate increased from 7.1% to 8.2% between 2004-2005 and 2009-2010 . A closer look reveals that this change was driven entirely by voluntary departures from the school, as median dismissals decreased over the same time period. It seems likely that increasing tuition levels combined with the recession’s economic affects played a role in these changes.
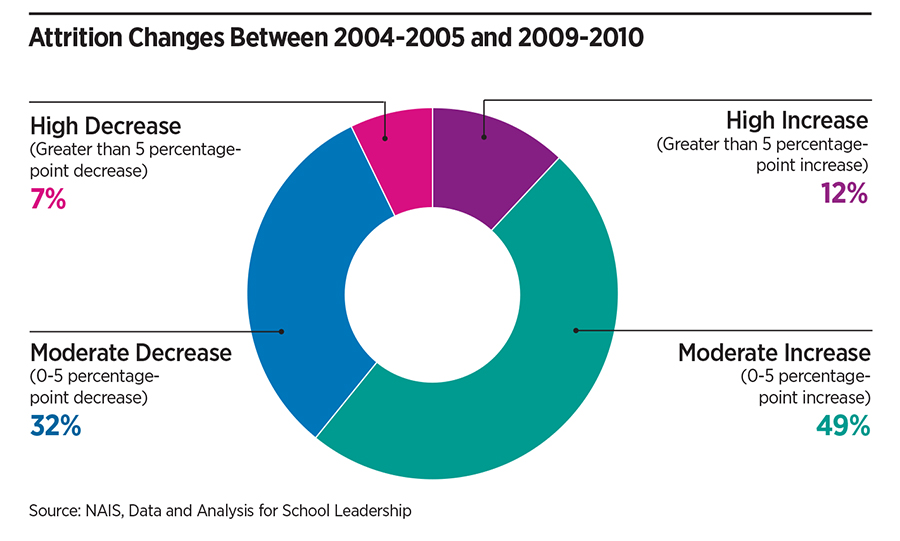
Sixty-one percent of schools experienced increasing attrition rates from 2004-2005 to 2009-2010. For about half of all schools (49%), this increase was moderate (below 5 percentage points). Almost a third of schools (32%) saw a moderate decrease in attrition. Smaller percentages of schools saw changes of more than 5 percentage points. (See the figure just below.) The positive news is that attrition returned to normal in the years following the Great Recession.
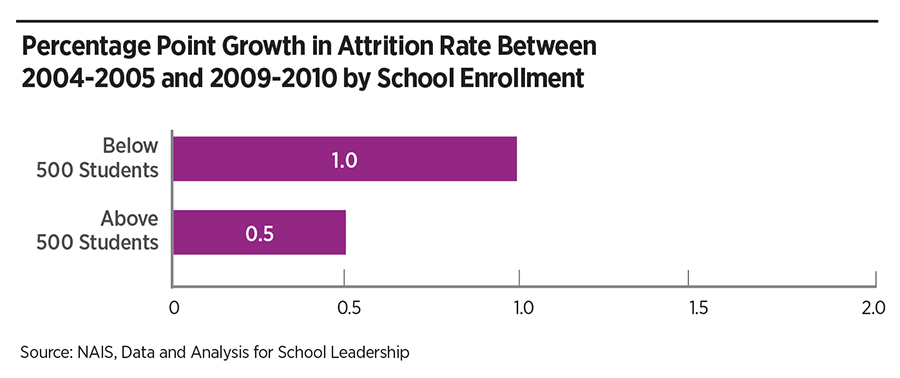
Attrition rate changes varied across school demographics, including school size and grades served. Smaller schools were more likely to experience larger increases in attrition. The median attrition rate for schools with fewer than 500 students increased by 1 percentage point, while the median attrition rate for schools with more than 500 students increased by only 0.5 percentage points. (See the figure just below.) In addition, smaller schools tended to have more significant changes in attrition, even in cases where attrition rates were decreasing. This could be the result of a having a smaller total student body. Smaller schools tend to be more reliant on each enrollee for continued operations.
In terms of grade level, lower schools experienced larger changes in attrition rates than K-12 schools. Between 2004-2005 and 2009-2010, the median attrition rate increased by 0.9 percentage points for lower schools and by 0.6 percentage points for K-12 schools. The median change for upper schools was 0.7 percentage points across the same time period. These changes may have more to do with school size than grade level, as K-12 schools tended to be significantly larger than either schools that serve elementary grades only or schools that serve secondary grades only, with a median enrollment of 713 compared to just over 300 for only-lower and only-upper schools.
While the trends of the last recession do not foretell what will happen in the current situation, studying them can help school leaders prepare for an uncertain future. Patterns in enrollment, admissions, and attrition are likely to have an impact in some form as schools begin to recover from the effects of the coronavirus.
The Trendbook, NAIS’s annual guide to issues affecting independent schools, includes research, data, Strategic Questions, Action Steps, and Resources. Read about additional trends in enrollment, financial aid, leadership, teaching and learning, and more in the 2020-2021 Trendbook, available in the NAIS Bookstore.